How many AI videos equal watching a Netflix movie? A tool launched last week by the Still Water lab lets students compare the hidden costs of digital habits across both AI and non-AI activities.
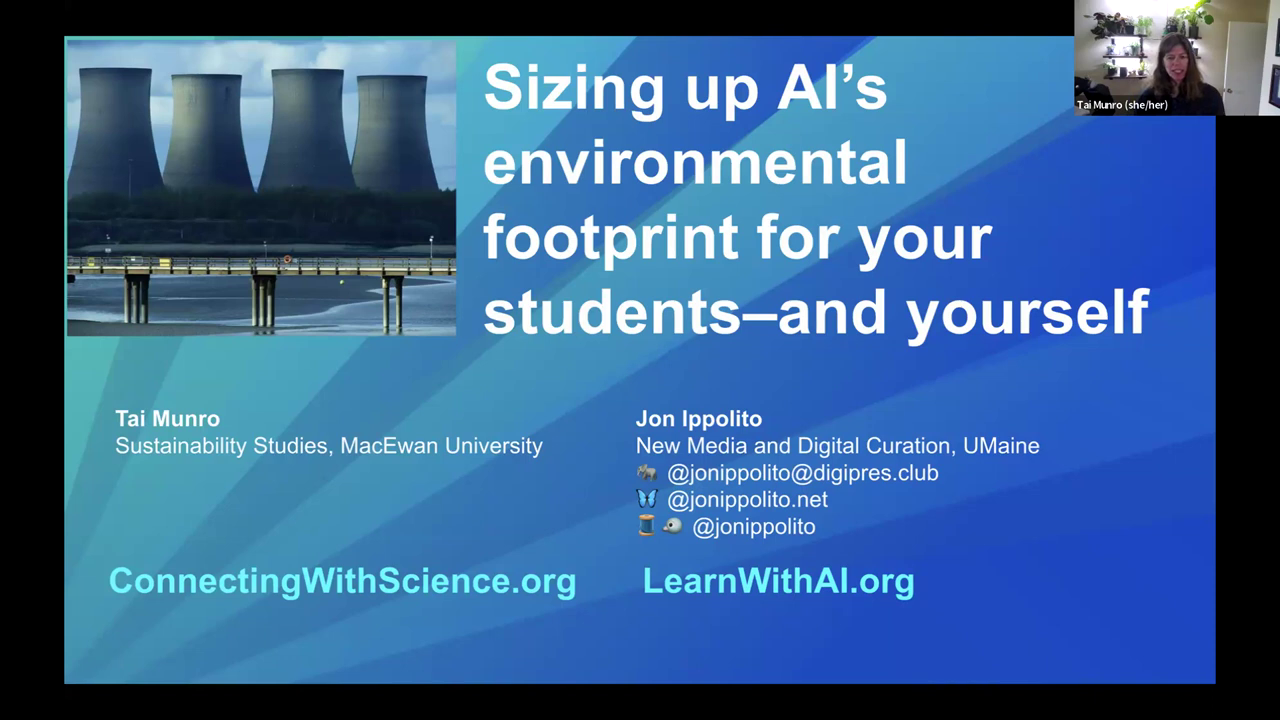
Last week, I had the chance to introduce a new app during a MyFest 2025 session I co-led with Tai Munro entitled “Sizing up AI’s Environmental Footprint—for Your Students and Yourself.” (The recording is now available on YouTube.)
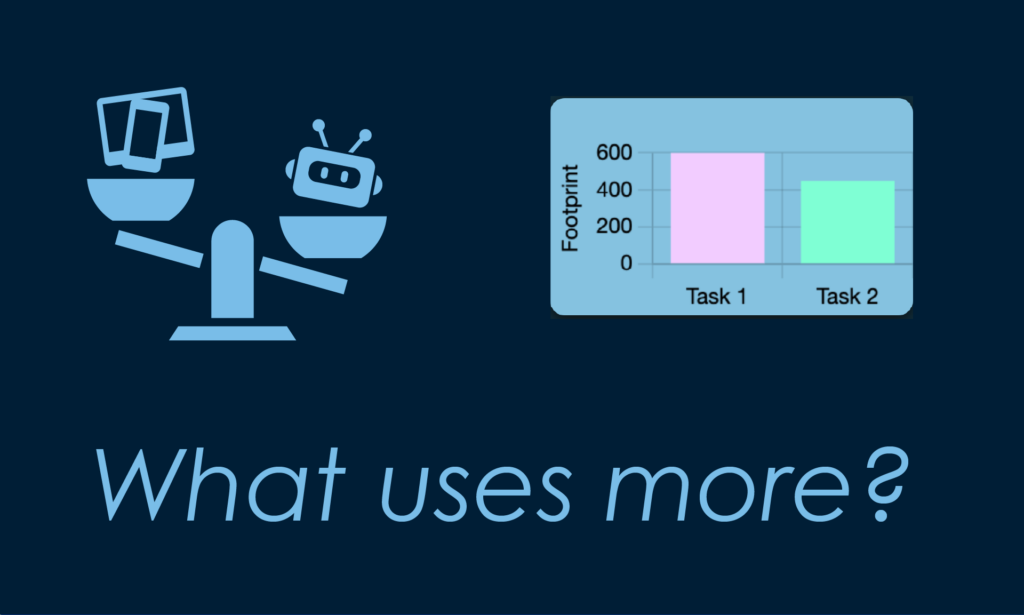
The tool I shared—What Uses More—grew out of a growing frustration with the increasingly partisan discussion online of AI’s environmental impact, with some quarters calling it an existential climate threat, others claiming it’s being blown out of proportion, and very few apples-to-apples comparisons. For students and educators trying to make sense of the issue, it’s nearly impossible to know what to trust.
 What Uses More is an attempt to sidestep the polarization and instead offer a way to think critically about the relative energy and water demands of AI tasks. It doesn’t make any predictions or moral claims—it just invites users to explore how resource use varies across a range of digital activities, both AI and non-AI.
For example, users can compare the energy and water needed to:
- Watch a one-hour Netflix movie
- Generate a 3-second AI video from text
- Search Google with and without AI
- Store 5 GB of data in the cloud for a month
- Run a ChatGPT prompt that generates a 500-word essay
The app draws on publicly available estimates from peer-reviewed research, corporate environmental disclosures, and expert models. All sources are cited in an open-access Google Sheet linked from the site. These figures are necessarily rough—the industry is tight-lipped about its own estimates, and we know energy and water use vary significantly depending on location, hardware, and modeling assumptions. The calculator is just a snapshot of energy and water use at inference; it doesn’t account for projected growth or indirect environmental costs like embedded energy, mining, or e-waste. It also doesn’t weigh other important harms, like labor exploitation or misinformation. For that broader analysis, I recommend pairing this with Still Water’s IMPACT RISK framework.
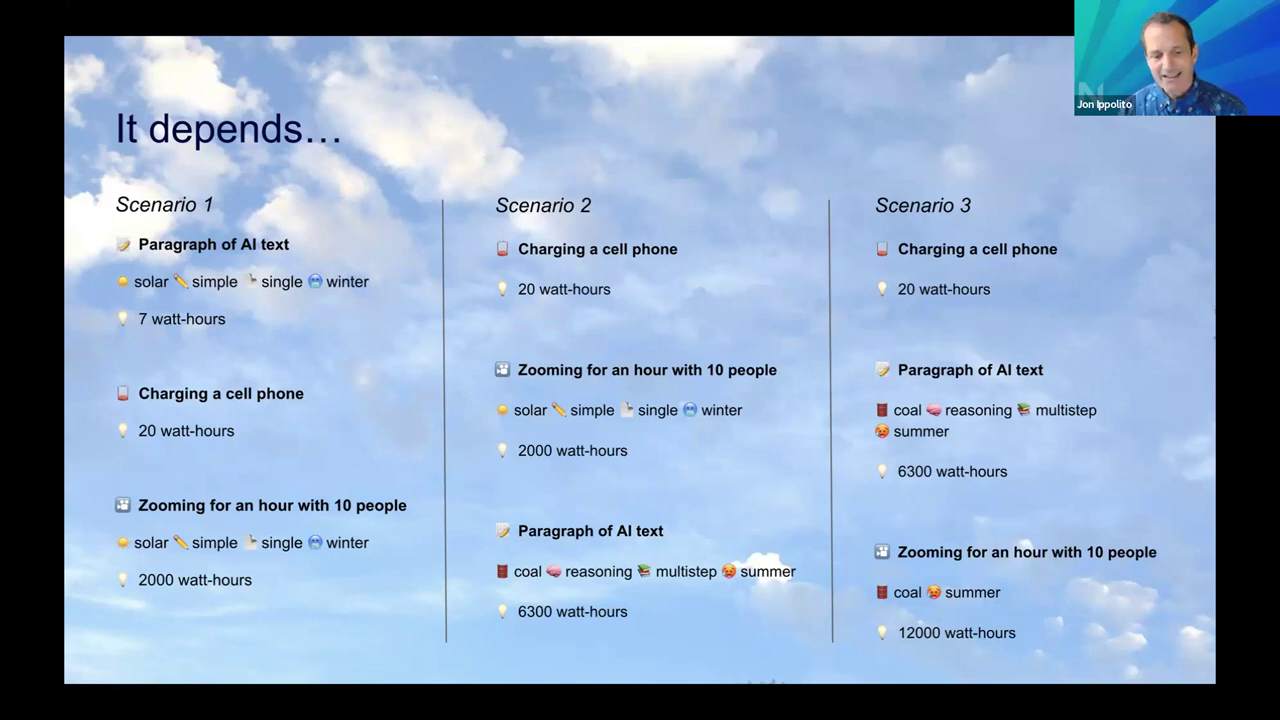 What this tool does is support hands-on, comparative exploration. In a classroom setting, students can start by selecting a familiar activity—like streaming video—then compare it to something more opaque, like AI image generation or file storage. They can adjust parameters like prompt complexity and local climate, and see how much those variables change the outcome.
My favorite exercise, which we explored in the webinar, is to tweak the parameters until you can find equivalences: how many 3-second AI-generated videos would equal the energy cost of participating in a 1-hour Zoom meeting? The goal isn’t to memorize numbers, but to understand how much context matters.
Tai led a great follow-up activity: after exploring the calculator, participants were asked to create personal or classroom guidelines based on what they’d learned. For instance, a student might decide they’ll reduce use of AI reasoning prompts when a Google search will do, or explore lower-footprint alternatives for storing large media projects.
We hope to keep the research driving the tool up to date, so please contact us with any suggestions, feedback, or new classroom uses.